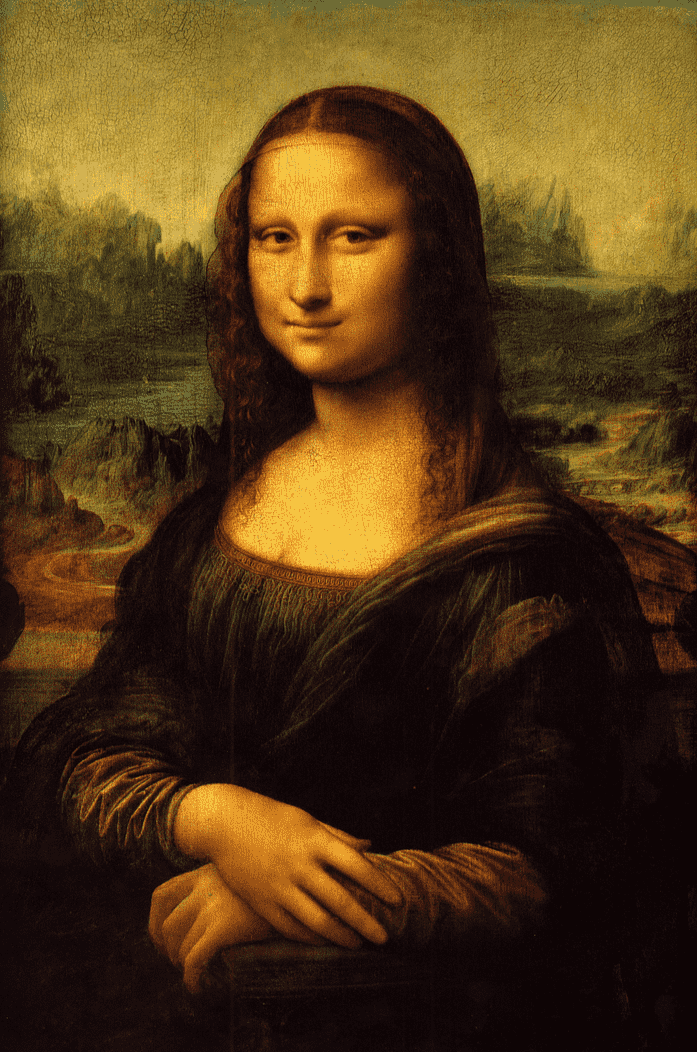
The Mona Lisa
Leonardo da Vinci’s Mona Lisa is one of the most famous paintings of all time. And there has always been a discussion around her enigmatic smile. He used a trademark Renaissance technique called sfumato, which involves many thin layers of glaze mixed with subtle pigments. The striking result is that when you look directly at Mona Lisa’s smile, it seems to disappear. But when you look at the background your peripherals see a smiling face.
One could spend decades studying the works of these masters from various perspectives, but if we want to hone in on the disappearing nature of that smile, mathematics can provide valuable insights. Indeed, though he may not have known the relationship between his work and da Vinci’s, hundreds of years later Salvador Dali did the artist’s equivalent of mathematically isolating the problem with his painting, “Gala Contemplating the Mediterranean Sea.”
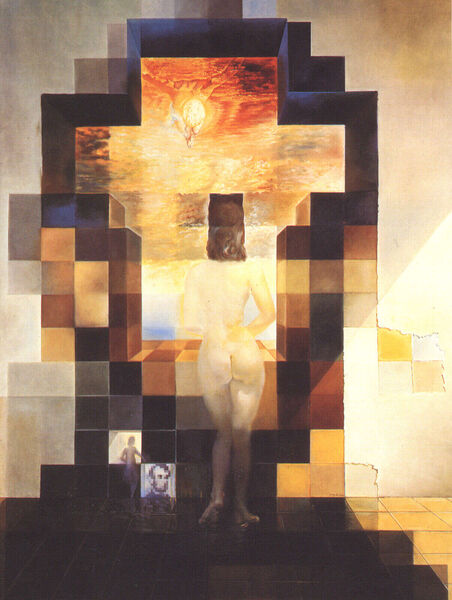
Gala Contemplating the Mediterranean Sea which at a distance of 20 meters is transformed into the portrait of Abraham Lincoln (Homage to Rothko) - Salvador Dali, 1974
Here you see a woman in the foreground, but step back quite far from the picture and there is a (more or less) clear image of Abraham Lincoln. Here the question of gaze is the blaring focus of the work. Now of course Dali and da Vinci weren’t scribbling down equations and computing integrals; their artistic expression was much less well-defined. But we the artistically challenged have tools of our own: mathematics, science, and programming.
In 2006 Aude Oliva, Antonio Torralba, and Philippe. G. Schyns used those tools to merge the distance of Dali and the faded smiles of da Vinci into one cohesive idea. In their 2006 paper they presented the notion of a “hybrid image,” presented below.
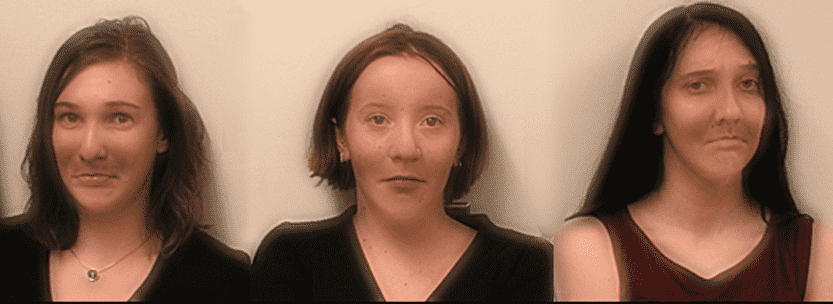
The Mona Lisas of Science
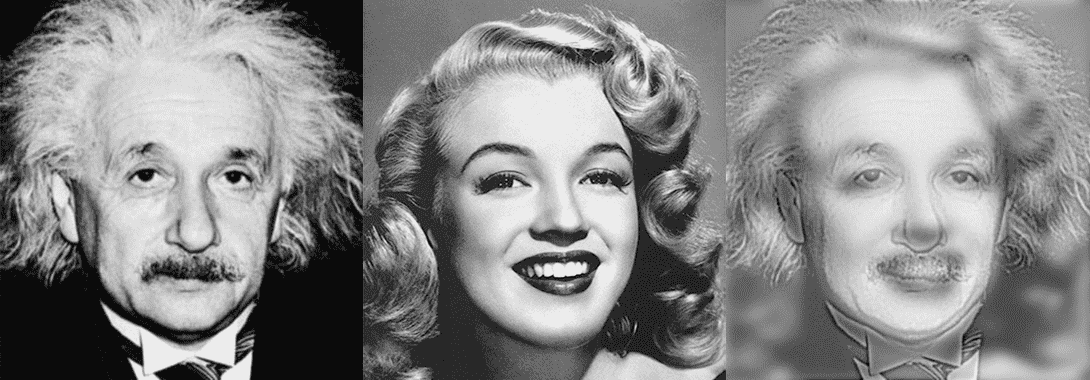
If you look closely, you’ll see three women, each of which looks the teensiest bit strange, like they might be trying to suppress a smile, but none of them are smiling. Blur your eyes or step back a few meters, and they clearly look happy. The effect is quite dramatic. At the risk of being overly dramatic, these three women are literally modern day versions of Mona Lisa, the “Mona Lisas of Science,” if you will.
Another, perhaps more famous version of their technique, since it was more widely publicized, is their “Marilyn Einstein,” which up close is Albert Einstein and from far away is Marilyn Monroe.
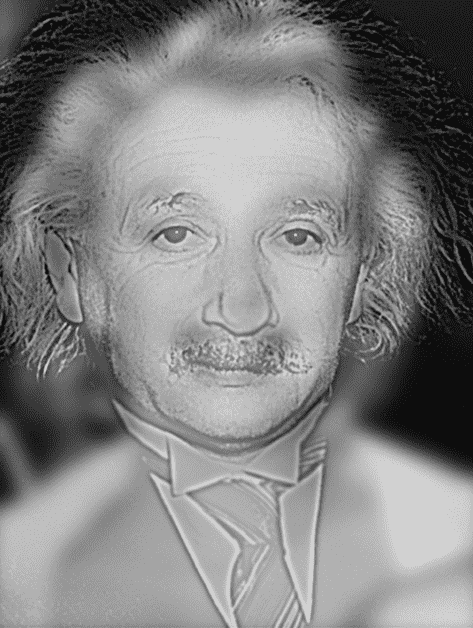
Marilyn Einstein
This one gets to the heart of the question of what the eye sees at close range versus long range. And it turns out that you can address this question (and create brilliant works of art like the ones above) with some basic Fourier analysis.
Intuitive Fourier analysis (and references)
The basic idea of Fourier analysis is the idea that smooth functions are hard to understand, and realization of how great it would be if we could decompose them into simpler pieces. Decomposing complex things into simpler parts is one of the main tools in all of mathematics, and Fourier analysis is one of the clearest examples of its application.
In particular, the things we care about are functions $ f(x)$ with specific properties I won’t detail here like “smoothness” and “finiteness.” And the building blocks are the complex exponential functions
$$\displaystyle e^{2 \pi i kx}$$where $ k$ can be any integer. If you have done some linear algebra (and ignore this if you haven’t), then I can summarize the idea succinctly by saying the complex exponentials form an orthonormal basis for the vector space of square-integrable functions.
Back in colloquial language, what the Fourier theorem says is that any function of the kind we care about can be broken down into (perhaps infinitely many) pieces of this form called Fourier coefficients (I’m abusing the word “coefficient” here). The way it’s breaking down is also pleasingly simple: it’s a linear combination. Informally that means you’re just adding up all the complex exponentials with specific weights for each one. Mathematically, the conversion from the function to its Fourier coefficients is called the Fourier transform, and the set of all Fourier coefficients together is called the Fourier spectrum. So if you want to learn about your function $ f$, or more importantly modify it in some way, you can inspect and modify its spectrum instead. The reason this is useful is that Fourier coefficients have very natural interpretations in sound and images, as we’ll see for the latter.
We wrote $ f(x)$ and the complex exponential as a function of one real variable, but you can do the same thing for two variables (or a hundred!). And, if you’re willing to do some abusing and ignore the complexness of complex numbers, then you can visualize “complex exponentials in two variables” as images of stripes whose orientation and thickness correspond to two parameters (i.e., the $ k$ in the offset equation becomes two coefficients). The video below shows how such complex exponentials can be used to build up an image of striking detail. The left frame shows which complex exponential is currently being added, and the right frame shows the layers all put together. I think the result is quite beautiful.
This just goes to show how powerful da Vinci’s idea of fine layering is: it’s as powerful as possible because it can create any image!
Now for digital images like the one above, everything is finite. So rather than have an infinitely precise function and a corresponding infinite set of Fourier coefficients, you get a finite list of sampled values (pixels) and a corresponding grid of Fourier coefficients. But the important and beautiful theorem is, and I want to emphasize how groundbreakingly important this is:
If you give me an image (or any function!) I can compute the decomposition very efficiently.
And the same theorem lets you go the other way: if you give me the decomposition, I can compute the original function’s samples quite easily. The algorithm to do this is called the Fast Fourier transform, and if any piece of mathematics or computer science has a legitimate claim to changing the world, it’s the Fast Fourier transform. It’s hard to pinpoint specific applications, because the transform is so ubiquitous across science and engineering, but we definitely would not have cell phones, satellites, internet, or electronics anywhere near as small as we do without the Fourier transform and the ability to compute it quickly.
Constructing hybrid images is one particularly nice example of manipulating the Fourier spectrum of two images, and then combining them back into a single image. That’s what we’ll do now.
As a side note, by the nature of brevity, the discussion above is a big disservice to the mathematics involved. I summarized and abused in ways that mathematicians would object to. If you want to see a much better treatment of the material, this blog has a long series of posts developing Fourier transforms and their discrete analogues from scratch. See our four primers, which lead into the main content posts where we implement the Fast Fourier transform in Python and use it to apply digital watermarks to an image. Note that in those posts, as in this one, all of the materials and code used are posted on this blog’s Github page.
High and low frequencies
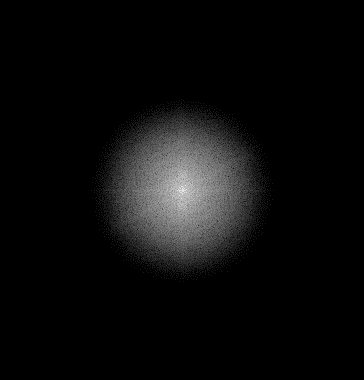
For images, interpreting ranges of Fourier coefficients is easy to do. You can imagine the coefficients lying on a grid in the plane like so:
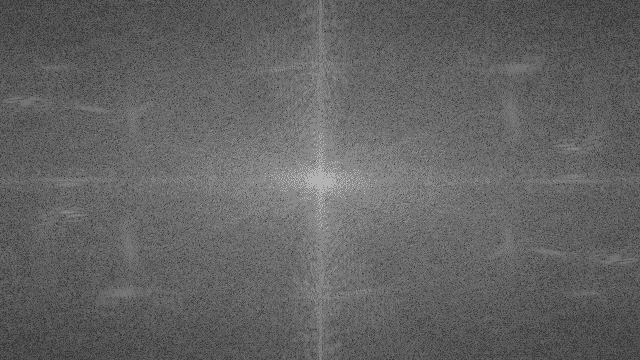
An example of a Fourier spectrum
Each dot in this grid corresponds to how “intense” the Fourier coefficient is. That is, it’s the magnitude of the (complex) coefficient of the corresponding complex exponential. Now the points that are closer to the origin correspond informally to the broad, smooth changes in the image. These are called “low frequency” coefficients. And points that are further away correspond to sharp changes and edges, and are likewise called “high frequency” components. So the if you wanted to “hybridize” two images, you’d pick ones with complementary intensities in these regions. That’s why Einstein (with all his wiry hair and wrinkles) and Monroe (with smooth features) are such good candidates. That’s also why, when we layered the Fourier components one by one in the video from earlier, we see the fuzzy shapes emerge before the fine details.
Moreover, we can “extract” the high frequency Fourier components by simply removing the low frequency ones. It’s a bit more complicated than that, since you want the transition from “something” to “nothing” to be smooth in sone sense. A proper discussion of this would go into sampling and the Nyquist frequency, but that’s beyond the scope of this post. Rather, we’ll just define a family of “filtering functions” without motivation and observe that they work well.
Definition: The Gaussian filter function with variance $ \sigma$ and center $ (a, b)$ is the function
$$\displaystyle g(x,y) = e^{-\frac{(x – a)^2 + (y – b)^2}{2 \sigma^2}}$$It looks like this
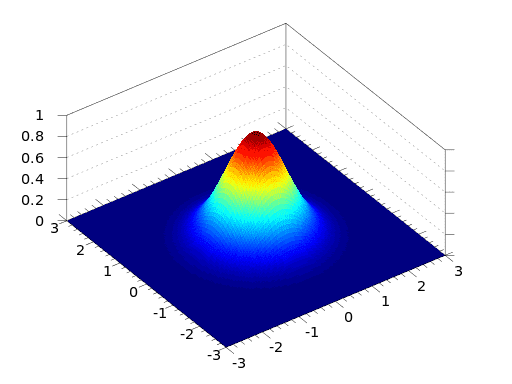
A Gaussian, image credit Wikipedia
In particular, at zero the function is 1 and it gradually drops to zero as you get farther away. The parameter $ \sigma$ controls the rate at which it vanishes, and in the picture above the center is set to $ (0,0)$.
Now what we’ll do is take our image, compute its spectrum, and multiply coordinatewise with a certain Gaussian function. If we’re trying to get rid of high-frequency components (called a “low-pass filter” because it lets the low frequencies through), we can just multiply the Fourier coefficients directly by the filter values $ g(x,y)$, and if we’re doing a “high-pass filter” we multiply by $ 1 – g(x,y)$.
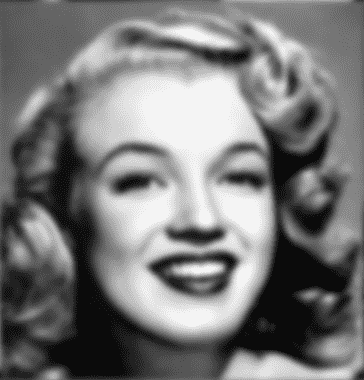
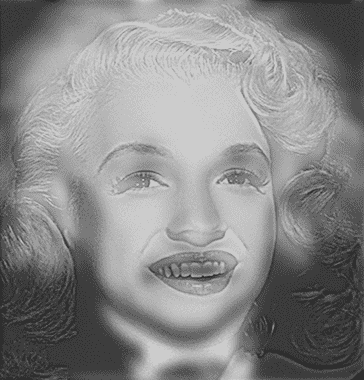
Before we get to the code, here’s an example of a low-pass filter. First, take this image of Marilyn Monroe
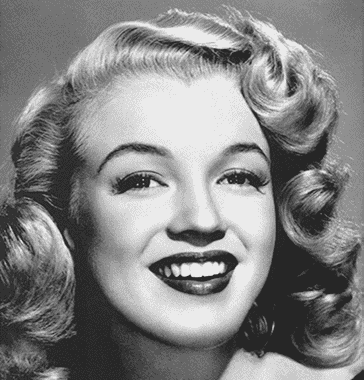
Marilyn Monroe
Now compute its Fourier transform
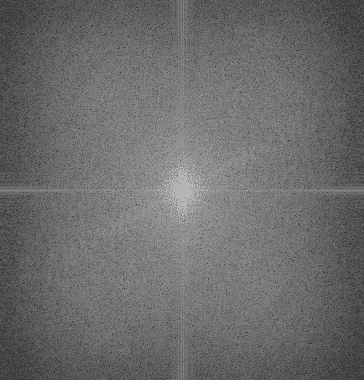
Marilyn's DFT
Apply the low-pass filter
Marilyn's Filtered DFT
And reverse the Fourier transform to get an image
Low-passed Marilyn
In fact, this is a common operation in programs like photoshop for blurring an image (it’s called a Gaussian blur for obvious reasons). Here’s the python code to do this. You can download it along with all of the other resources used in making this post on this blog’s Github page.
import numpy
from numpy.fft import fft2, ifft2, fftshift, ifftshift
from scipy import misc
from scipy import ndimage
import math

def makeGaussianFilter(numRows, numCols, sigma, highPass=True):
   centerI = int(numRows/2) + 1 if numRows % 2 == 1 else int(numRows/2)
   centerJ = int(numCols/2) + 1 if numCols % 2 == 1 else int(numCols/2)

   def gaussian(i,j):
      coefficient = math.exp(-1.0 * ((i - centerI)**2 + (j - centerJ)**2) / (2 * sigma**2))
      return 1 - coefficient if highPass else coefficient

   return numpy.array([[gaussian(i,j) for j in range(numCols)] for i in range(numRows)])

def filterDFT(imageMatrix, filterMatrix):
   shiftedDFT = fftshift(fft2(imageMatrix))
   filteredDFT = shiftedDFT * filterMatrix
   return ifft2(ifftshift(filteredDFT))

def lowPass(imageMatrix, sigma):
   n,m = imageMatrix.shape
   return filterDFT(imageMatrix, makeGaussianFilter(n, m, sigma, highPass=False))

def highPass(imageMatrix, sigma):
   n,m = imageMatrix.shape
   return filterDFT(imageMatrix, makeGaussianFilter(n, m, sigma, highPass=True))

if __name__ == "__main__":
   marilyn = ndimage.imread("marilyn.png", flatten=True)
   lowPassedMarilyn = lowPass(marilyn, 20)
   misc.imsave("low-passed-marilyn.png", numpy.real(lowPassedMarilyn))
The first function samples the values from a Gaussian function with the specified parameters, discretizing the function and storing the values in a matrix. Then the filterDFT function applies the filter by doing coordinatewise multiplication (note these are all numpy arrays). We can do the same thing with a high-pass filter, producing the edgy image below
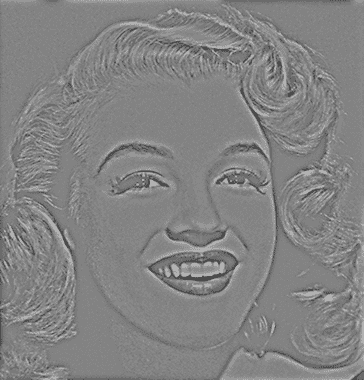
High-passed Marilyn
And if we compute the average of these two images, we basically get back to the original.
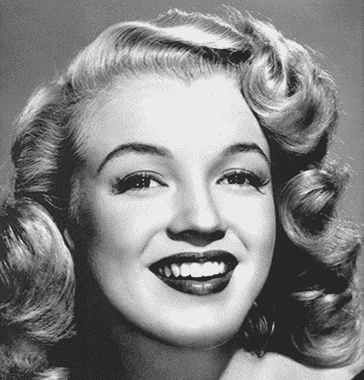
Sum of two Marilyns
So the only difference between this and a hybrid image is that you take the low-passed part of one image and the high-passed part of another. Then the art is in balancing the parameters so as to make the averaged image look right. Indeed, with the following picture of Einstein and the above shot of Monroe, we can get a pretty good recreation of the Oliva-Torralba-Schyns piece. I think with more tinkering it could be even better (I did barely any centering/aligning/resizing to the original images).
Albert Einstein, Marilyn Monroe, and their hybridization.
And here’s the code for it
def hybridImage(highFreqImg, lowFreqImg, sigmaHigh, sigmaLow):
   highPassed = highPass(highFreqImg, sigmaHigh)
   lowPassed = lowPass(lowFreqImg, sigmaLow)

   return highPassed + lowPassed
Interestingly enough, doing it in reverse doesn’t give quite as pleasing results, but it still technically works. So there’s something particularly important that the high-passed image does have a lot of high-frequency components, and vice versa for the low pass.
The reverse high/low pass
You can see some of the other hybrid images Oliva et al constructed over at their web gallery.
Next Steps
How can we take this idea further? There are a few avenues I can think of. The most obvious one would be to see how this extends to video. Could one come up with generic parameters so that when two videos are hybridized (frame by frame, using this technique) it is only easy to see one at close distance? Or else, could we apply a three-dimensional transform to a video and modify that in some principled way? I think one would not likely find anything astounding, but who knows?
Second would be to look at the many other transforms we have at our disposal. How does manipulating the spectra of these transforms affect the original image, and can you make images that are hybridized in senses other than this one?
And finally, can we bring this idea down in dimension to work with one-dimensional signals? In particular, can we hybridize music? It could usher in a new generation of mashup songs that sound different depending on whether you wear earmuffs 🙂
Until next time!
Want to respond? Send me an email, post a webmention, or find me elsewhere on the internet.