As a fun side project to distract me from my abysmal progress on my book, I decided to play around with the math genealogy graph!
For those who don’t know, since 1996, mathematicians, starting with the labor of Harry Coonce et al, have been managing a database of all mathematicians. More specifically, they’ve been keeping track of who everyone’s thesis advisors and subsequent students were. The result is a directed graph (with a current estimated 200k nodes) that details the scientific lineage of mathematicians.
math-genealogy-website
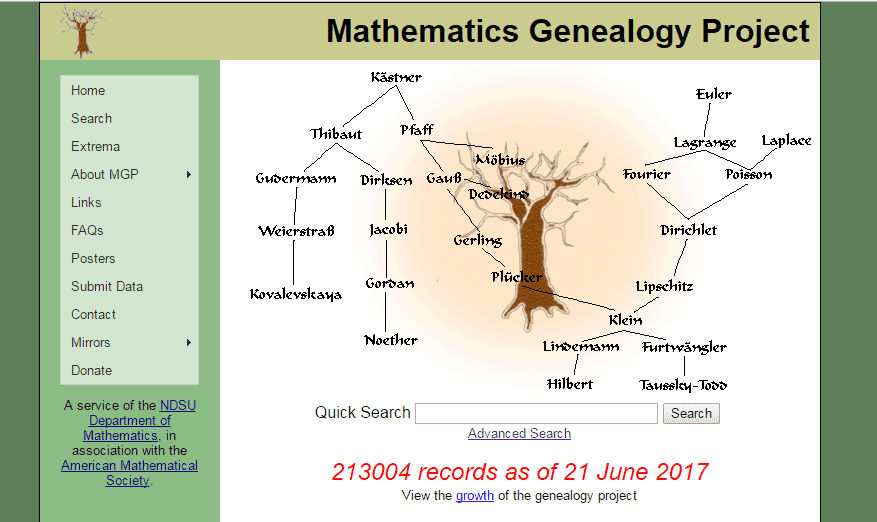
Anyone can view the database online and explore the graph by hand. In it are legends like Gauss, Euler, and Noether, along with the sizes of their descendant subtrees. Here’s little ol’ me.
It’s fun to look at who is in your math genealogy, and I’ve spent more than a few minutes clicking until I get to the top of a tree (since a person can have multiple advisors, finding the top is time consuming), like the sort of random walk that inspired Google’s PageRank and Wikipedia link clicking games.
Inspired by a personalized demo by Colin Wright, I decided it would be fun to scrape the website, get a snapshot of the database, and then visualize and play with the graph. So I did.
Here’s a github repository with the raw data and scraping script. It includes a full json dump of what I scraped as of a few days ago. It’s only ~60MB.
Then, using a combination of tools, I built a rudimentary visualizer. Go play with it!
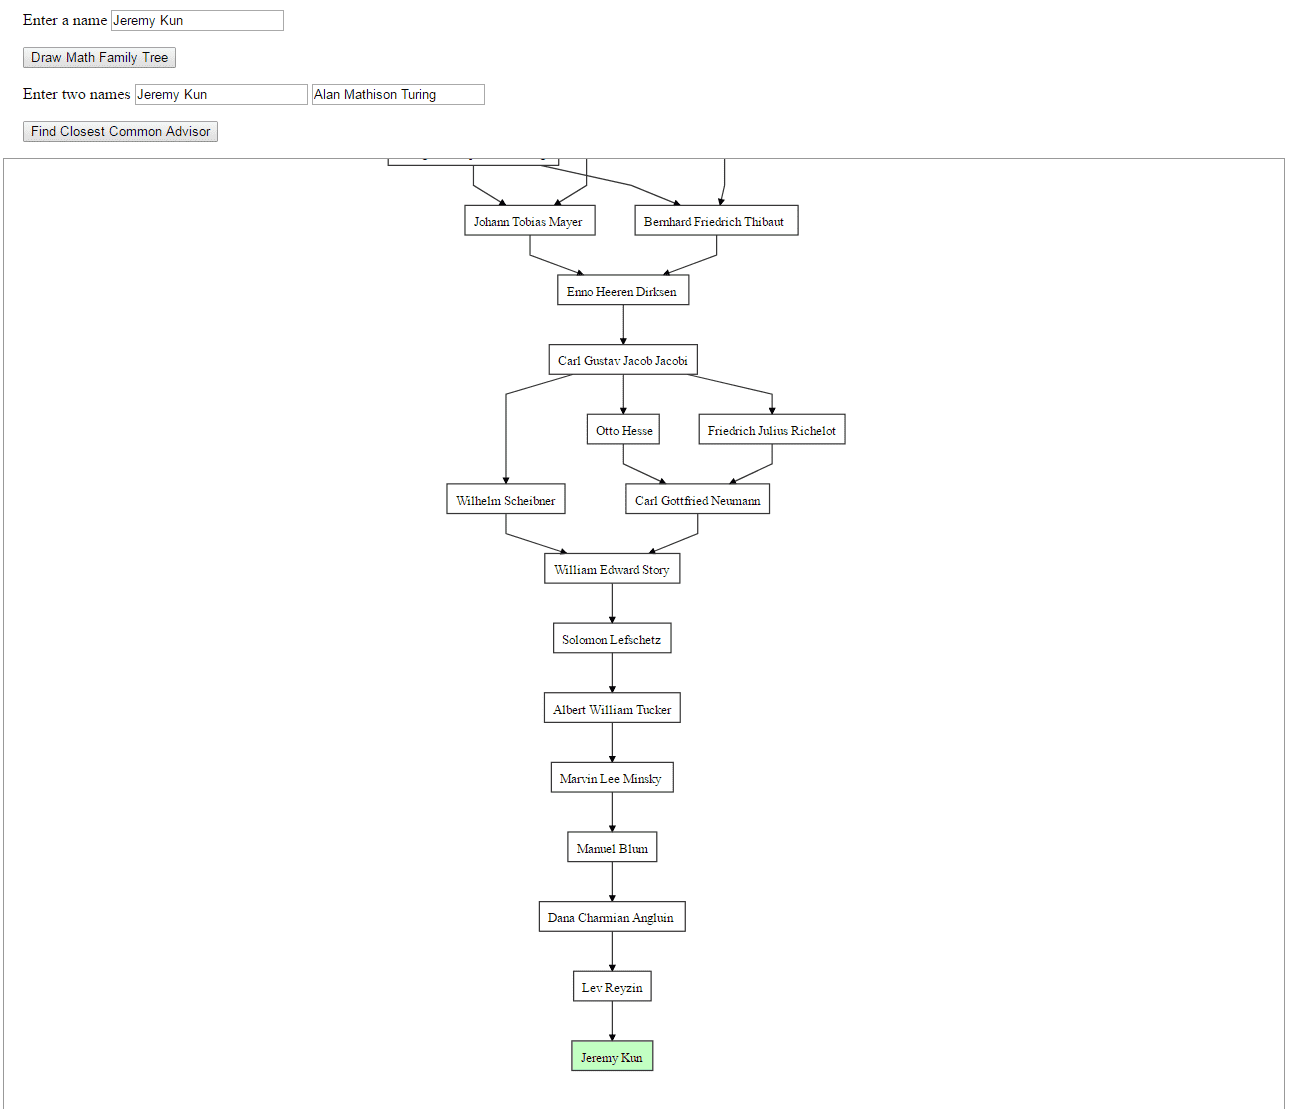
mathgenealogyexample
A few notes:
- It takes about 15 seconds to load before you can start playing. During this time, it loads a compressed version of the database into memory (starting from a mere 5MB). Then it converts the data into a more useful format, builds a rudimentary search index of the names, and displays the ancestors for Gauss.
- The search index is the main bloat of the program, requiring about a gigabyte of memory to represent. Note that because I’m too lazy to set up a proper server and elasticsearch index, everything in this demo is in Javascript running in your browser. Here’s the github repo for that code.
- You can drag and zoom the graph.
- There was a fun little bit of graph algorithms involved in this project, such as finding the closest common ancestor of two nodes. This is happening in a general digraph, not necessarily a tree, so there are some extra considerations. I isolated all the graph algorithms to one file.
- People with even relatively few descendants generate really wide graphs. This is because each layer in the directed graph is assigned to a layer, and, the potentially 100+ grandchildren of a single node will be laid out in the same layer. I haven’t figured out how to constrain the width of the rendered graph (anyone used dagre/dagre-d3?), nor did I try very hard.
- The dagre layout package used here is a port of the graphviz library. It uses linear programming and the simplex algorithm to determine an optimal layout that penalizes crossed edges and edges that span multiple layers, among other things. Linear programming strikes again! For more details on this, see this paper outlining the algorithm.
- The scraping algorithm was my first time using Python 3’s asyncio features. The concepts of asynchronous programming are not strange to me, but somehow the syntax of this module is.
Feature requests, bugs, or ideas? Open an issue on Github or feel free to contribute a pull request! Enjoy.