Last week I was in Boston for the Geometry of Redistricting workshop. It was an optimistic gathering of over 500 mathematicians, computer scientists, lawyers, policy makers, teachers, and interested people of all stripes.
There was a ton of information in the talks and subsequent discussions. I’ll try to distill the main ideas and avenues for research as best I can. Unfortunately, due to how preliminary most of the technical work is, I won’t be presenting any concrete code or algorithms. Rather I’ll just give a high level sketch with as many links as I can find. If you want to skip my blabbering and watch some of the talks yourself, the morning talks were taped and publicized on YouTube.
The speakers were almost unanimous in a few central tenets, each of which I’ll expand on:
- In order for mathematics to helpful in fighting partisan gerrymandering, it needs to be in touch with the intricacies of the legal, political, and local aspects of the problem.
- The “obvious” ideas have all essentially been tried and rejected for various reasons, both mathematical and legal.
- There is a huge gray area in between what’s easy and what’s known to be hard where mathematics can help, and lots of tentative ideas are on the table.
Grounded in People and Law
Partisan gerrymandering is the process of drawing voting district lines to help one party win more representatives. As you probably know, every 10 years the US Census Bureau tries to count everyone in the country along with basic demographic information. Then, because the US Constitution requires proportional representation in Congress based on state populations, states may gain or lose seats in Congress, and are given the power to reevaluate how they translate individual citizen votes into representatives. Part of this process is redrawing voting district lines, and when politicians take advantage of this to further a political cause, it’s called gerrymandering.
The most common kinds of gerrymandering have two forms, packing and cracking, which work in unison to give delegates of one party more representation that the global statistics of a state would suggest. Packing is the process of putting all of one’s opponents in the same district, so that their votes in excess of 50% are essentially wasted. In conjunction, in cracking one spreads out members of the opposing party in such a way that they represent a safe minority of their districts, say 45%. In this way, even a state that has an overall majority in favor of one party can result in dominant representation by the other party.
One particularly interesting example is Michigan. In 2010, state Republicans redrew district lines—as is required following every US Census. They did so in a way that is considered by many an extreme partisan gerrymander. One piece of evidence supporting this is the statistics mentioned above: while Michigan is evenly split statewide between Democrats and Republicans, Republicans took 57% of the state legislature’s House. You can see packing and cracking at work: many of the districts that voted Democratic have win-ratios in excess of 80%, while most Republican districts near those metropolitan areas eked out with leads as low as 51%. As far as I can tell, only a single Republican state senate district took significantly more than 60% of that district’s vote.
Two caveats. First: of course this is just evidence, not proof, but it should (and did) raise a red flag considering this country’s history of gerrymandering. Second: it would be unfair to single out Republicans, because Democrats are notoriously good at Gerrymandering. They’ve just been on the losing end of the battle recently.
What’s potentially worse than the fact that one party is winning is that the dominant party gets to draw the lines. This is a uniquely American idea that apparently horrifies visiting politicians from Europe. One obvious solution is to simply force legislatures to give up their redistricting power to independent commissions. California, along with a few other states, have done this. And other states with only one delegate, such as Montana and Delaware, don’t have this problem. But the remaining 40-some-odd states appear heavily resistant to giving up this power.
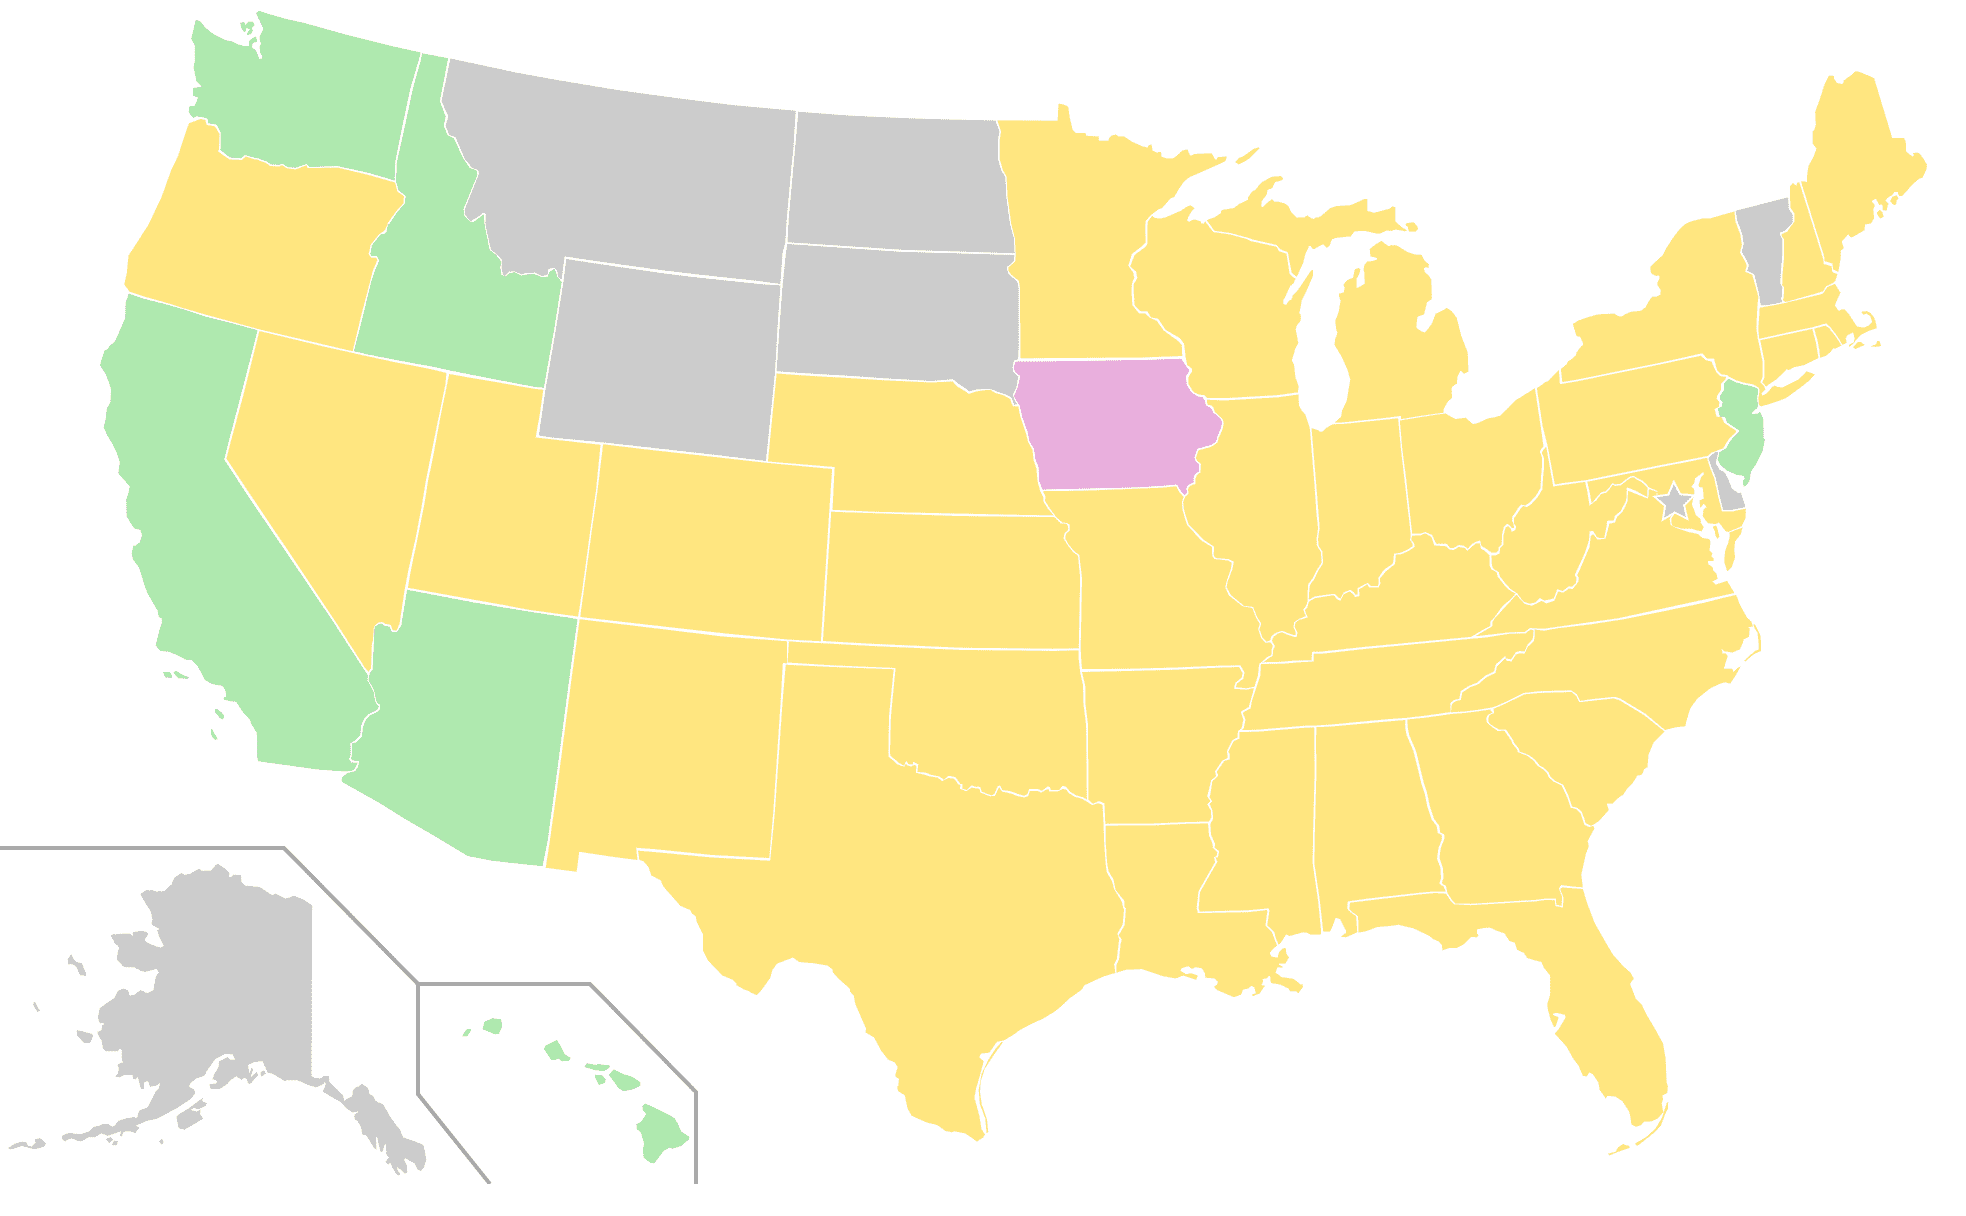
Independent commissions for US House redistricting. Green states have independent commissions, yellow states have incumbents draw district lines, gray states have only one representative.
It’s obvious why incumbent politicians don’t want to relinquish their power: gerrymandering is super effective! It’s also obvious why geographic line-drawing works: people of like-minded ideology tend to live near each other. As Moon Duchin ribbed during her opening talk, “Democrats like to huddle for warmth.” More specifically, densely populated areas correlate with liberal voters. What’s more, it even correlates with density conditioned on being in a city! What’s more more, within a city, it correlates with how much you use public transportation! So the more data you have, the better you can gerrymander.
And, at the very least, this shows that any support or opposition for a redistricting plan needs to be heavily informed by the local, cultural, and even infrastructural details of the region in question. But even more, it shows how inherently political this process is. Politicians who don’t play the game will literally lose their jobs.
And, for the most part, courts tend to agree. In 1962 there was a landmark court case, Baker v. Carr, that crystalized this opinion (for a wonderful narrative, see the More Perfect podcast). In fact, Baker v. Carr was a case about the state’s inaction; the district lines in Tennessee hadn’t been redrawn since 1900, and in the mean time the population changed so that rural votes counted for about 10 urban votes. The Supreme Court ruled 6-2 against Tennessee, and laid out an opinion that said two things:
- Federal courts have the authority to hear redistricting cases on the basis of partisanship.
- However, it’s really hard to tell what counts as illegal partisan gerrymandering. The court admitted that they required a “judicially discoverable and manageable standard” for resolving them.
The consequences, through this and some followup cases, were a standard essentially called “one person one vote,” which means district lines have to match up with population density. But beyond that, and some vague I-know-it-when-I-see-it notions about “compactness” and “aesthetically pleasing shapes,” the Supreme court has demurred against ruling on political gerrymandering cases for exactly this lack of a judicial standard (cf. Vieth 2004).
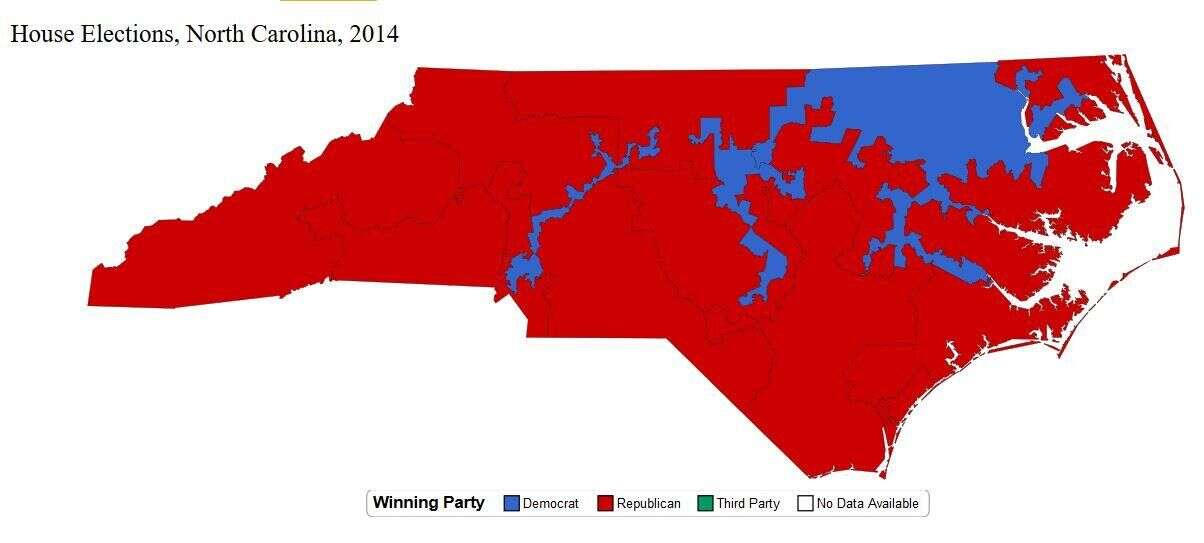
North Carolina’s famously gerrymandered 1st and 12th house districts, rejected by the courts on account of ugliness and “tortured” shape. Source: wunc.org
The supreme court doesn’t want to enter this “political thicket,” as Justice Frankfurter declared in Baker v. Carr, for authentic reasons. Foremost among them, a political issue is by definition never resolved. The losing side never thinks they had a fair shot. A justice system that hears redistricting cases (which take years to resolve) will be swamped in litigation before, during, and after every election. Some reasonably think that the only good way to end gerrymandering is for the people to hold states accountable (and/or Congress) and make them pass laws ending gerrymandering. It shouldn’t be the court’s job to make policy.
[Soapbox] In my humble and lightly-informed opinion, this is probably the right attitude. But organizing people to change such an entrenched policy requires a long, state-by-state slog over the century to win out. What’s worse is that it seems, for the average person, gerrymandering is an inherently boring topic not likely to galvanize the masses. It’s not as universal and visible as other successful movements like women’s right to vote or the Voting Rights Act, each of which took decades. Either way, via courts or state constitutional amendments, the people involved will need to lay out convincing arguments, and mathematics and computer science can certainly help. [/Soapbox]
Fast forward to today, you have Gill v. Whitford set for October 3rd, and the court is split with Justice Kennedy undecided. Kennedy, the swing vote, has had previous gerrymandering cases thrown out due to this lack of a “manageable standard,” but he’s left open the possibility that a good standard exists. Gill v. Whitford sets forth what’s called the efficiency gap, which may become such a standard despite its flaws.
Roughly speaking, the efficiency gap is said to measure how many votes were “wasted” on each side, via an arithmetic formula that counts both votes in excess of 50% for a winning district, and all votes cast for losing candidates. An article by Mira Bernstein and Moon Duchin (two of the four organizers of the conference) adeptly outline the deficiencies of this measure, and how it might play out in the courtroom.
Enter math, take 1
While the judicial value of the efficiency gap remains to be seen, the mathematical parts of the workshop highlighted ways the mathematical community could be of service.
But before that, we spent some time highlighting ways that mathematics has failed to be of service, and the damage that does to future efforts. As one speaker put it, people came up with 60 suggested metrics for courts to use, and they were all rejected, so why would they listen to what we propose for metric number 61?
The obvious ideas one might first come up with have all been deemed to be hard or invalid. In particular, an immediate thought one would probably have is to use optimization: simply write down all the atomic units of population (census blocks), write down all the constraints, and run a solver to get the optimal district plan.
The problem is far more complicated, and one could write a long article about all the reasons why. One simple explanation is that this program is just too big. The US has 11 million census blocks (many states have around 200,000), each of which is a polygon with potentially many vertices—due to the intricacies of the geography such as rivers separating districts. As such, people have taken to representing the problem as a graph over the set of census blocks, with edges connecting adjacent nodes.
Still, almost every optimization “constraint” is soft, but it’s not clear how soft and what exceptions are permissible. For example, standard practice tries to keep towns in the same district, has to split big cities somehow, and all the while there is an unofficial mandate to keep “communities of interest” together. This last one could be people living in areas affected by local wildfires, people united by a shared language, or any one of a number of minority groups. The optimization formulation is out of touch with the guiding principles. Nobody has figured out how to represent all of the information relevant to redistricting in a way amenable to algorithmic analysis.
In this domain, rather than trying to solve a problem that is more complicated than it seems, well-modeled math must faithfully represent some set of values the court agrees with. Dr. Duchin pointed some of these out in her talk:
- Equal representation is good, as voiced by the “one person one vote” doctrine.
- Geographical division is important, i.e. bare majorities shouldn’t override the voice of communities of interest.
- Extremist agendas should not outweigh the majority.
- Elections should be competitive. The opportunity for useful alternatives should exist in areas that are equally divided.
- States should still be governable. This is why things like supermajorities are acceptable as part of the give and take of politics.
Points 2 and 3 are in direct opposition, as are 4 and 5, and each of these principles, even if you don’t agree with them, have legal standing in the US. But these principles don’t obviously translate into something like an optimization problem. How do you encode the presence of extremist agendas in an objective function? The sense I got from the workshop is that people have tried, and largely failed.
Other techniques, like evaluating the geometric shape of a district for “compactness”—a legal term long recognized by the court but with no concrete definition—run into trouble with issues like the coast of England paradox. In fact, most metrics attempting to measure non-compactness—of the kind ruled illegal in North Carolina’s 1st and 12th districts—can change by a factor of 3 based on how finely one measures geographical features. Justin Solomon covers this and many more pitfalls of the geometry of redistricting in his talk.
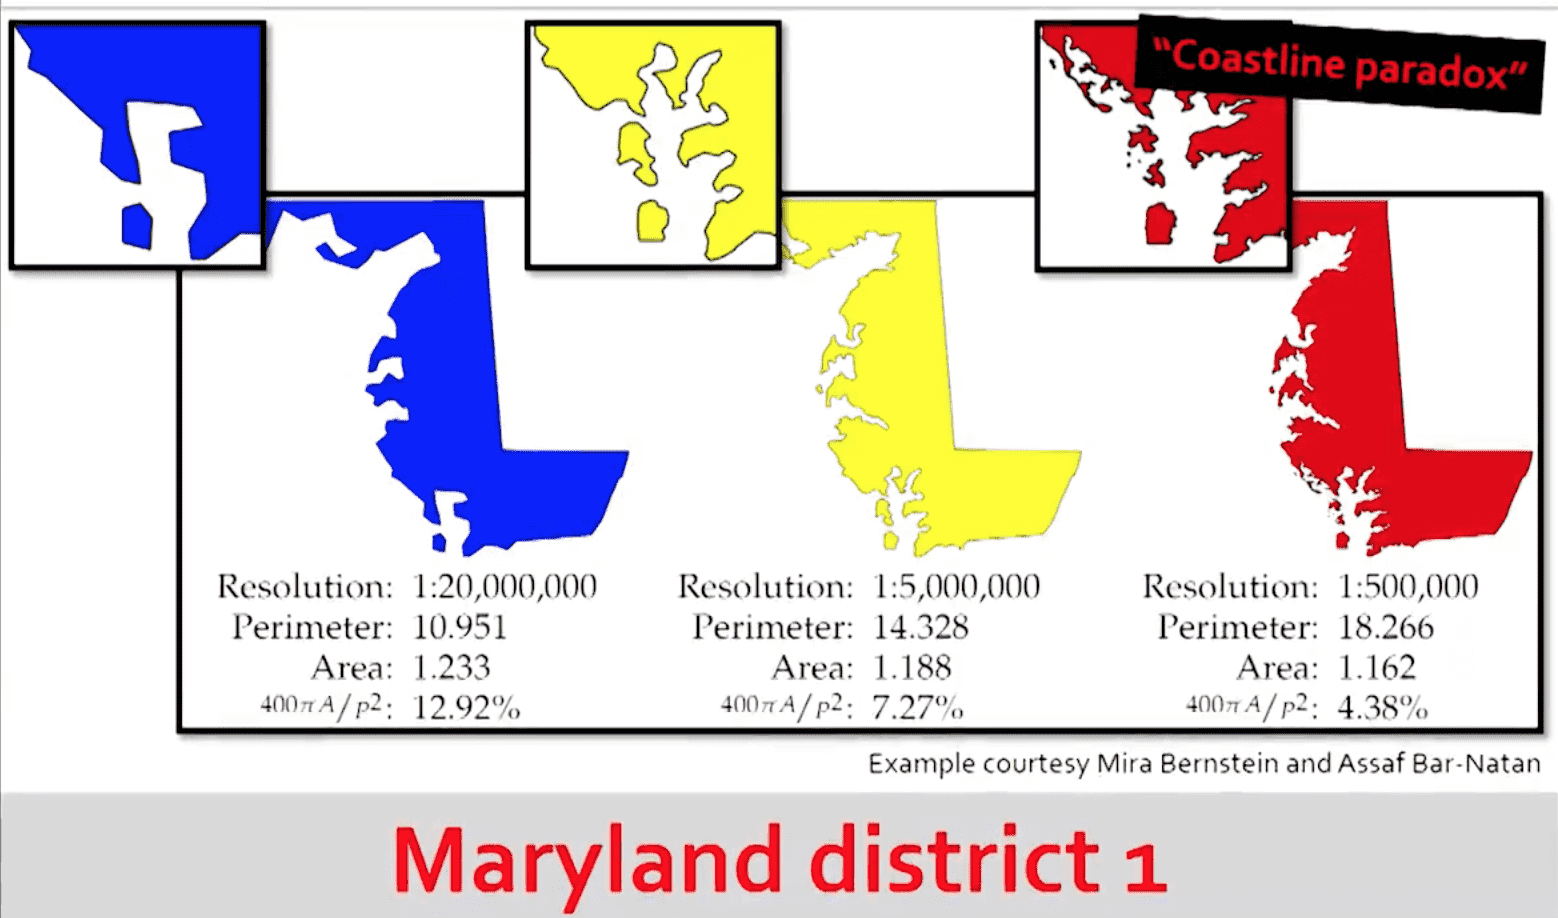
Maryland’s district 1, with compactness measured at different resolutions. Taken from Dr. Solomon’s slides.
Math, take 2
In addition to spending a lot of time outlining the potential pitfalls of existing techniques, the workshop presented ideas aiming to be informative.
There was much talk of metrics, but an even more fundamental problem I found appealing was that of sampling. If you’re trying to show a court that a proposed districting plan is illegally gerrymandered, it would be helpful to provide alternative plans for comparison. Even better would be a large, independent random sample of a billion plans, which you could use to draw a distribution of whatever statistic you’re interested in, and show where the proposed plan lies.
Again, extremity is not the only factor in whether a partisan gerrymander is illegal (thanks to Justice Kennedy), but it does play a role. And without a sample for comparison, “extremity” is just an opinion. Sampling was the topic of this talk by Wendy Cho and some subsequent sessions and discussions.
But the distribution of all “legal, plausibly good redistricting plans” is extremely complicated, for all of the reasons we’ve mentioned in this post. As fans of this blog will know, if you have a complicated distribution and you want to sample from it, you can use a technique called Markov Chain Monte Carlo (MCMC). Indeed, researchers have tried this (cf. the recent work of Fifield et al.) but there are some important considerations.
First, the theory of MCMC says that, if you run the algorithm for long enough, eventually the tail end of the sequence will be a representative sample. This is called the “mixing time,” and it’s relatively sensitive to the way the problem is set up. The theory of MCMC doesn’t say how long mixing takes, and indeed many hard problems are known to take exponential time. To complement this, problem, the existing work on using MCMC has resulted (according to experiments conveyed to me by Dr. Cho, who in fairness has a competing line of research detailed below) in almost exactly one redistricting sampled per CPU hour. So the second problem is that, even if you did have rapid mixing, it would take a long time and resources to come up with a good representative sample of, say, a billion possible plans.
Cho and her coauthor presented their variant of this line of research, based on genetic algorithms. In this scheme, the “optimization” part of genetic algorithms serves only to meet the constraints and desires required of all redistricting plans (keep towns together, etc.). They are able—with the aid of a supercomputer—generate many more plans and much faster. Part of the appeal of their technique is that they can turn on and off different features to optimize for at will, and dictate how much they’re trying to optimize for each feature. So they can compare a large sample of plans generated while trying to optimize for partisan bias to a large sample of plans generated without that objective.
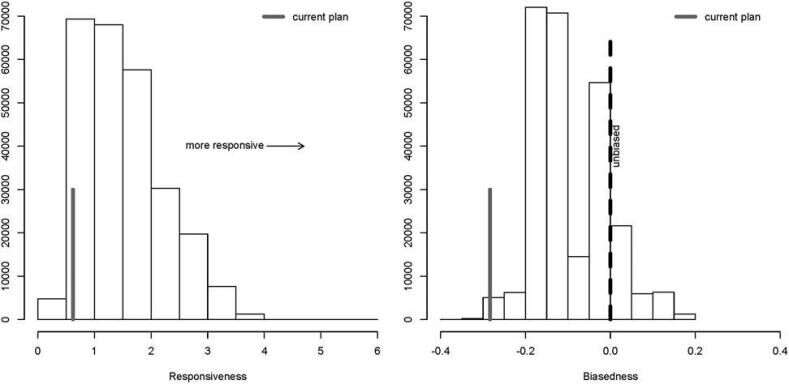
An example of a sample of districting plans plotted in terms of some statistics. From [Cho-Liu 2016](http://web.archive.org/web/20240212011105/http://cho.pol.illinois.edu/wendy/papers/talismanic.pdf)
On the other hand, their obstacle is a problem of purity. Genetic algorithms are about as far as you can get from a well understood theory. The particular choices required to model redistricting using genetic algorithms pretty much eliminate any hope of proving that the resulting sample is an independent random sample. This seems like a huge problem in litigation, as one could argue back and forth (as we did at the workshop) as to what features of the genetic approach made it “acceptably” random.
Indeed, maybe a sample doesn’t need to be perfectly random. Simply having alternative schemes with no discernible partisan bias might be enough for a court (who knows?). But still, I got the impression from the workshop that the more caveats one needs to explain a mathematical technique to a court, the less likely it will be accepted as legitimate. This even applies to techniques that have been accepted in mathematics for centuries.
Speaking of complicated, next we turn to Dr. Duchin’s line of work, which she succinctly describes as “measuring compactness using discrete Ricci curvature.” Ricci curvature is hard enough to describe succinctly without knowing what a smooth manifold is in technical terms. One of the many equivalent definitions is based on comparing neighborhoods of points. This lends itself nicely to a discrete analogue for graphs, an idea first put forth by Yann Ollivier. Cf. his papers on the topic, though I found them quite difficult because they lean heavily on intuition from Riemannian geometry, which I’m not very familiar with. However, the idea involves a neat concept called earth mover’s distance (which has three or four other names) which I want to write about in more detail soon. In particular, it’s part of this field of optimal transport which studies how to modify geometric notions (particularly measurements) to probability distributions. It’s like a “fuzzy geometry” where you don’t know exactly where things are, or exactly what shape they are, but you want to measure distance and volume keeping uncertainty in mind. Seems super useful for a field like redistricting, where the data is dirty and the lines are not absolutely certain.
Ricci curvature lends itself nicely to talking about things like “compactness” (which conveniently is a recognized concept in the courts). In particular, curvature tells you about the geometry of a manifold in ways that seem useful, but I’m not exactly sure how that connects to redistricting. Duchin et al. have been working to make that connection, and they claim it’s a more rigorous way to describe the compactness of a district. Apparently, they can translate some of the intuition from the study of geometric group theory to this problem. I eagerly await some written thing I can scour for details 🙂
Finally, the workshop had much discussion about open source GIS (geographical information systems) projects oriented around bringing redistricting planning to the public. They mentioned some really cool projects like Azavea’s DistrictBuilder, which has influenced district planning all across the country, to my surprise including my childhood home of Contra Costa County, CA. They organized a GIS hackathon for the last few days of the workshop, and they promised to mention the results of that hackathon soon.
Next steps
For those who didn’t participate in the special sessions (which were invite only), one of which included training to be an expert witness in gerrymandering cases, there was little in the way of obvious next steps. The workshop was super informative, but at this point things are very tentative and there are a lot of open directions for research and software projects.
If you’re interested in getting involved, consider coming to one of the next workshops in the series. The upcoming October workshop in Wisconsin is open for registration, which should be particularly juicy since it will occur right after the Supreme court hears arguments on Whitford v. Gill. And there are subsequent workshops in November (Durham, North Carolina), February (Austin, Texas), and March (San Francisco, CA). I’ll likely be at the San Francisco one.
I think those with GIS experience, or those willing to learn GIS, would be quite inspired by the breadth of open problems this workshop provides. And moreover, at least a few companies that do geographic data analysis (for social causes or otherwise) were actively recruiting, so there’s that.9
Until next time!
Want to respond? Send me an email, post a webmention, or find me elsewhere on the internet.